라쉬분석에 기반한 노년층 15문항 삼킴기능 간단평가(BISA-15)의 타당성 검증
Validation of the 15-item Brief Inventory of Swallowing Ability (BISA-15) for Older Adults Based on a Rasch Analysis
Article information

Abstract
배경 및 목적:
노화에 따른 삼킴기능의 변화는 노년층에서 가파르게 만연되고 있는 현상이다. 따라서 자가설문조사를 통해 지역사회 노년층 스스로의 삼킴기능과 삼킴관련 삶의질을 어떻게 인식하는지를 확인하는 것이 필요하다. 이 연구에서는 기개발된 삼킴기능 26문항의 자가보고설문지에 대해 추가적인 타당성 확보를 위하여 라쉬분석을 실시하고자 하였다.
방법:
총 479명의 노인들(남자:여자= 238:241, 평균 연령 75.6±7.17세)을 대상으로 26개의 문항이 포함된 설문평가를 실시하였다. 라쉬모델을 적용하기 위하여 WINSTEP® 프로그램(버전4.4.6)을 활용해 문항들의 타당성과 신뢰성을 확인하였다.
결과:
문항적합통계(item fit statistics)를 통해, 26개 중 11개 문항이 모델에 적합하지 않음을 확인하였으며, 최종 도출된 15-문항 삼킴기능 간단평가(Brief Inventory of Swallowing Ability, BISA-15)는 차원수(dimensionality)와 문항적합통계 측면에서 일차원적(unidimensional) 구성을 확인할 수 있었다. 전반적인 문항 신뢰도는 우수하였으나, 대상자 신뢰도(person reliability)는 다소 낮았다. 평정척도(rating scales)는 일부 범주를 통합한 후 재분석되어 세 범주로 축소되었다.
논의 및 결론:
라쉬분석을 통해 확인된 BISA-15은 정상에서 임상전단계로 전이되는 삼킴기능을 탐지하는데 활용될 수 있을 것이다. 향후, 노년층에서 좀 더 폭넓은 연령대 및 다양한 환자군에게 도구유용성이 검증되는 연구가 필요한 것으로 사료된다.
Trans Abstract
Objectives
Aging-related changes in swallowing functions have rapidly become prevalent among the elderly. Self-reported questionnaires are often conducted to observe how people perceive their swallowing functions, and to report the swallowing-associated quality-of-life. This study was conducted to demonstrate the use of Rasch analysis for validating the pre-developed self-reported questionnaire to assess swallowing functions for community-dwelling older adults.
Methods
A total of 479 older adults (men=238, mean age±SD=75.6±7.17 years) were enrolled. Twenty-six items with respect to swallowing functions were completed by the participants. Each item investigated symptom frequency or severity on a 5-point Likert scale. A Rasch analysis using the WINSTEP® program was undertaken to establish validity and reliability of the questionnaire.
Results
From the item fit statistics analysis, 11 out of 26 items were shown to be misfits to the model. Thus, the 15-item Brief Inventory of Swallowing Ability (BISA-15) was derived and demonstrated a unidimensional scale based on the dimensionality and item fit statistics. The overall item reliability was excellent. The person reliability was lower than the required threshold. The rating scales needed to collapse into three categories both in frequency and severity (i.e., never, sometimes/moderate, often/severe).
Conclusion
The BISA-15 can be utilized to detect degree of aberrations in swallowing that transit from normal to subclinical stage in older adults. Future studies are warranted to further clarify the utility of the BISA-15 in a wide range of age in the elderly as well as in the various clinical populations.
Population aging is global concern. The number of people aged 65 or older is approximately 7.37 million in Korea, accounted for 14.3% of its total population in 2018, and the percentage of elderly is expected to increase steadily by 41% in 2060 (Statistic Korea, 2018). The greying population brings about a wide variety of health care issues. In particular, presbyphagia, a term that refers to aging-related changes in swallowing functions, has rapidly become prevalent among the elderly. In recent research, some reported prevalence of presbyphagia as high as 15% among the community-dwelling older adults (Madhavan, LaGorio, Crary, Dahl, & Carnaby, 2016). Thus, it is imperative to look into the swallowing functions when evaluating health risks for the elderly.
Self-reported questionnaires are often conducted to see how targeted people perceive their swallowing functions, and to report swallowing-associated quality-of-life (Morisaki, 2017). To date, there have been numerous questionnaires developed based on classical test theory (CTT). Classical test theory is ‘a traditional quantitative approach to testing the reliability and validity of a scale based on its items’ (Cappelleri et al., 2014). However, one of limitations in CTT is that it describes reliability and validity based upon the total test as a whole thus characteristics of items are not examined in detail. For example, an assessment scale has been developed to evaluate the risk of chewing and swallowing problems among frail community-dwelling elderly persons (Miura, Kariyasu, Yamasaki, & Arai, 2007) and the test was evaluated merely with Cronbach’s alpha coefficient and via factor analysis, one of the CTT methods. Moreover, upon applying a Rasch analysis on pre-developed self-reported questionnaires on swallowing, it was reported that they are lacking in their construct validity and internal consistency (Cordier et al., 2017; Cordier et al., 2018; Wilmskoetter et al., 2019). Despite this, Eating Assessment Tool-10 (EAT-10) is one of the more widely used questionnaire tool to measure swallowing function as well as associated quality-of-life, however it has been criticized by some researchers for its lack of validity in this regard (Cordier et al., 2017).
On the other hand, item response theory (IRT) is a reportedly more powerful and effective methodology to improve the reliability of a questionnaire by providing internal consistency and structural validity (Cordier et al., 2017). Contrary to CTT, the IRT model reveals the probability of an individual obtaining a correct response on a test item. It also provides the distinct benefit of a visually appealing person-item map, which suggests to what extent the items cover the targeted range of the underlying scale and whether the items align with the target patient population (Cappelleri et al., 2014).
Among several swallowing assessment tools published to date, the self-reported questionnaire included in the Swallowing Monitoring & Assessment Protocol (SMAP) has been validated in terms of content validity (Kim, Kim, & Lee, 2018) and concurrent validity (Kim et al., 2019). One important distinction between our work and the other questionnaires is that the former was designed specifically for measuring and monitoring swallowing functions in community-dwelling older individuals by focusing on symptoms observed before and during the preclinical stage. Since reported prevalence rate of swallowing complaints among older adults may vary depending on item contents and numbers of a questionnaire (González-Fernández, Humbert, Winegrad, Cappola, & Fried 2014; Holland et al., 2011; Inui et al., 2017), item analyses are of partucular importance to detect swallowing problems and to refer individuals with these problems for further evaluation.
Within this context, the present study aimed to evaluate the self-reported questionnaire items on swallowing functions for the elderly via Rasch analysis in order to explore the psychometric properties of the evaluation tool before its wide usage. By doing so, we would be able to reduce to an adequate number of the questionnaire items which could be sensitive enough to detect dysphagia symptoms presented by the community-dwelling older adult before and during preclinical stage in otherwise healthy elderly.
METHODS
Participants
The participants in this study were part (i.e., between February 2017 and December 2018) of an ongoing larger project of swallowing in older adults, including an experimental pilot study between October 24, 2016 and July 31, 2017 as well as the main research (Stage I) between November 1, 2017 and July 31, 2019 (Kim et al., 2018; Kim et al., 2019). A total of 479 individuals (men=238) were recruited through the convenient sampling procedure from senior welfare community centers in the metropolitan area of Seoul and Gyeonggi Province. The subject eligibility criteria were as follows: 1) 65 years of age or older; 2) independently living; and 3) providing a consent to the study. The mean age was 75.6 years (SD=7.17) and mean years of education were 10.2 (SD=4.97). They had mean score of 25.3 (SD=4.54) on the Korean-Mini Mental State Examination (K-MMSE, Kang, 2006) (Table 1).

Participant Characteristics (n=479)
Procedures
Approval from the Institutional Review Board (IRB) was obtained prior to conducting the study. Before carrying on data collection, the researchers obtained written consent from each individual who expressed their willingness to participate after explaining the purpose and procedure of the study. One-on-one interview using structured self-reported questionnaire was completed.
Measurement
The measurement tools used in this study were newly developed to identify swallowing and chewing problems of elderly people living in the community (Kim et al., 2018; Kim et al., 2019). The items were constructed building upon previous studies and the content and concurrent validities were verified. Each item investigated symptom frequency (0=Never, 1=Seldom, 2=Sometimes, 3=Often, 4=Always) or severity (0=Never, 1=Mild, 2=Moderate, 3= Severe, 4=Very severe) on a 5-point Likert scale.
Statistical Analysis
The Rasch model was applied in order to assess the reliability and validity of the questionnaire using WINSTEPS® version 4.4.6 (Linacre, 2019a). In this study, the joint maximum likelihood estimation was used as a rating scale estimation because the questionnaire consisted of a Likert scale and employed the same rating scale for all items.
Dimensionality and item fit statistics
Dimensionality is determined by 1) identifying potentially problematic items evidenced by negative point-measure correlations; 2) using Rasch fit values to identify misfit items; and 3) conducting a Rasch factor analysis using the Principal Component Analysis method of Residuals (PCAR) (Linacre, 1998). Point-measure correlations were examined for the sake of identifying potentially misfit items, as well as to ensure all items were in a positive direction indicating they had the potential to contribute to the overall construct (Bond & Fox, 2015). The item fit statistics that describe how accurately or predictably the responses pertaining to that item fit the model. In order to judge the item fit, four categories of fit statistics were measured. The infit and outfit statistics consist of both mean squares (MNSQ) and z-standardized scores (Z-STD). Acceptable item MNSQ values range from 0.6 to 1.4 for infit and outfit statistics with Z-STD scores between -2 and +2 (Bond & Fox, 2015). A value of MNSQ greater than 1.4 indicates that the item in the questionnaire fails to define the same construct as the others (and is deemed “underfit”), an MNSQ value less than 0.6 occurs when the model predicts better data than expected, but does not always damage the model (deemed to be “overfit”) (Bond & Fox, 2015). PCAR is used to discover secondary dimensions observed in the unexplained variance after the Rasch dimension has been removed from ordinal data. In this study, the following two criteria were used to verify unidimensionality via PCAR: 1) >40% variance of the data is explained by the Rasch dimension (variance explained) and 2) eigenvalue of the 1st contrast is lower than 2 (Cordier et al., 2017; Linacre, 2019b).
Reliability
The person reliability index refers to the Cronbach alpha coefficient, which indicates the replicability of subject ordering if the sample of persons was given another set of items that measured the same construct. The person separation (if the outlying measures are accidental) and person separation index (PSI)/strata (if the outlying measures represent true performances; [(4*person separation)/3] are used to arrange people. The PSI/strata of 3 is needed to consistently identify three different levels (low, medium, high) of performance (the minimum level required to attain a reliability of 0.9) (Linacre, 2019b). The item reliability index indicates the internal consistency reliability of multi-item scales. In general, a separation index ≥3.0 and separation reliability ≥0.9 are considered excellent (Bond & Fox, 2015).
Rating scale
The rating scale diagnostics were determined as follows: 1) average measures were used for the vertical arrangement (lowest score to highest); 2) outfit MNSQ was less than 2.0; 3) the difference in the thresholds between adjacent categories was between 1.0 and 5.0 logits. When the rating scale was identified as inappropriate, adjacent categories were combined and the data reanalyzed (Bond & Fox, 2015).
RESULTS
Dimensionality and item fit statistics
All items demonstrated positive point-measure correlation directions. From the item fit statistics analysis, 11 out of 26 items were shown to be misfits to the model. Underfit of either infit or outfit scores (MNSQ>1.4 or Z-STD>2.0) was observed for the following items (No. 1, 2, 3, 4) as shown (in boldface) in Table 2: “It is hard to sip water or drink with a straw”, “It is harder to smell (food) than before”, “There has been a decrease in the amount of food I eat”, and “My mouth is usually dry or I feel thirsty”. Overfit of either infit or outfit scores (MNSQ<0.6 or Z-STD<-2.0) was shown for the following items (No. 8, 10, 16, 21, 23, 25, 26): “It is hard to swallow water or liquid”, “My throat hurts when I swallow food”, “I feel like something is stuck in my throat when I eat”, “Chew-ed food gets stuck in my throat makes it difficult to breathe”, “My pronunciation has become sloppier than before”, “It is hard to swallow saliva”, and “It is difficult to swallow chewed food”. Thus, 11 out of 26 items have been removed. As a result of dimensionality with PCAR, the Rasch dimension explained 40.1% of the variance with >40% considered a strong measurement of dimension. But the eigenvalue of the 1st contrasts was 2.84, suggesting the existence of a secondary component in the data (Table 3). Therefore, we further investigated into the disattenuated correlations between the person measures in the clusters of items. The disattenuated correlations of our data were all 1.0. Out of the 15 items, 2 items (e.g., No. 7, “I have chewing problem”, and No. 13, “My voice has changed compared to the past”) represent the most frequently reported problems among the older adults. The least reported items were No. 5, “Water or food comes out of my nose” and No. 9, “I get out of breath when I eat”, meaning that the majority of subjects scored these items as no problem (Figure 1).
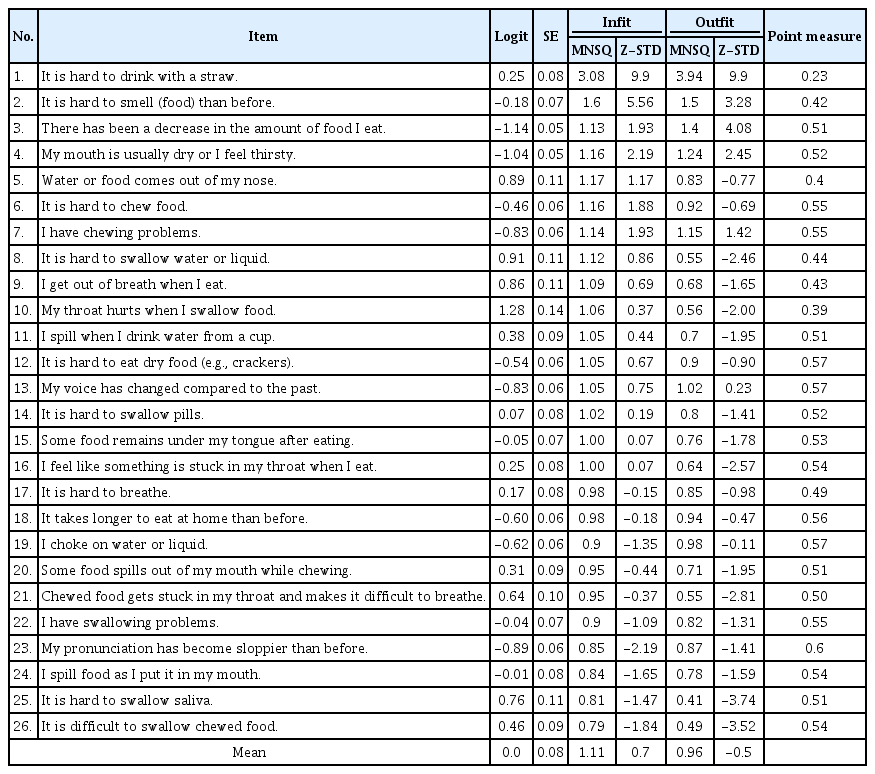
Item fit statistics for 26 items of the self-reported questionnaire
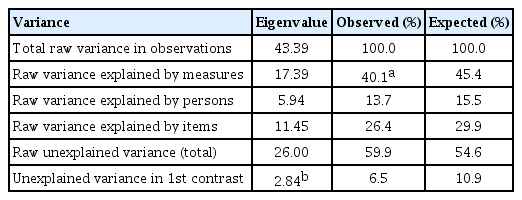
Standardized residual variance
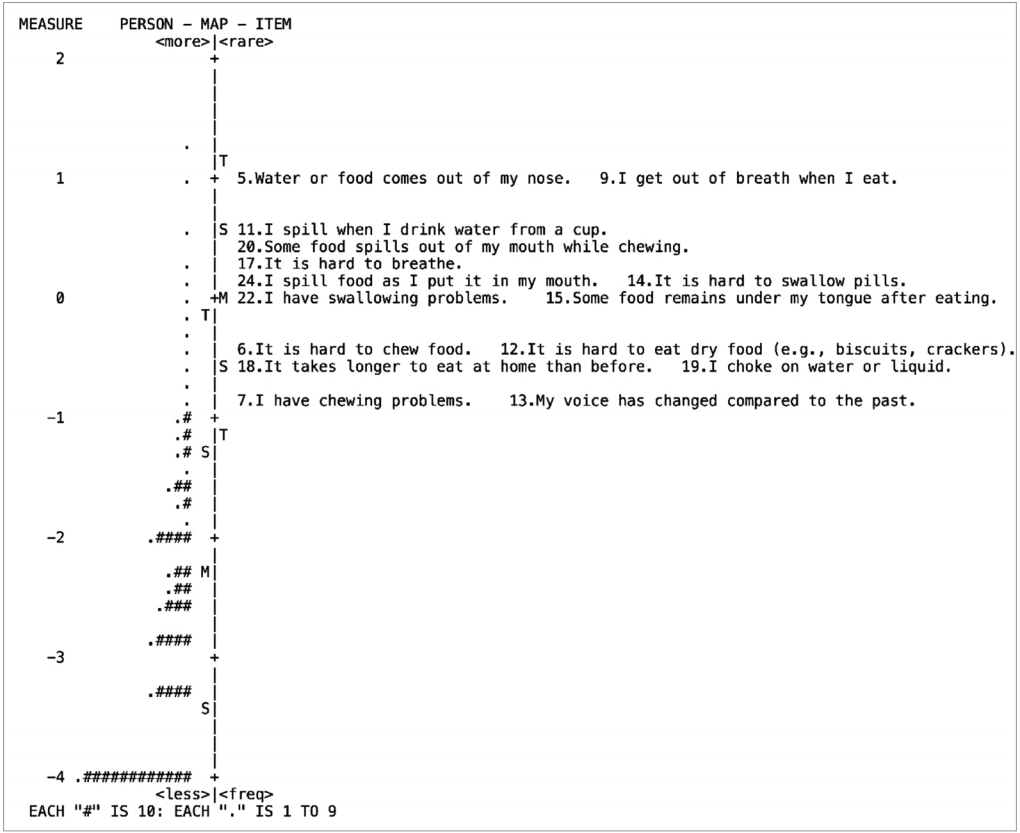
Wright map of 15 items.
Separation reliability
The summary fit statistics pertaining to item and person ability demonstrated good fit to the model based on both infit and outfit statistics, featuring an excellent reliability estimate for items (0.98). The person reliability measure was an acceptable level (0.74) with a person strata of 2.24, which is slightly lower than the required minimum person separation index of 3 to reliably separate people into distinct strata of ability (Table 4).
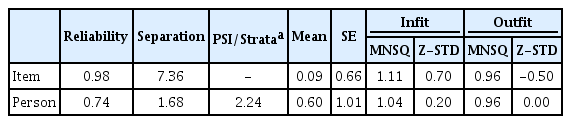
Item and person summary statistics
Rating scale
The self-reported questionnaire is a 5-point rating scale featuring increasing category order (i.e., 0 through 4), but the average measure scores do not increase monotonically. Goodness of fit statistics were all acceptable, except for category 4 (outfit MNSQ= 6.18). Examination of the Rasch-Andrich thresholds revealed disordered thresholds, with the threshold for categories 0-1 (none to -0.83), 1-2 (-0.83 to -0.56), and 2-3 (-0.20 to 1.59) advancing by <1.0 (Table 5). These findings indicate that consideration should be given to collapsing categories, in which rating scale use should be reexamined.
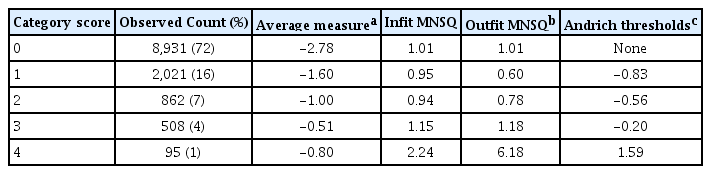
Diagnostics for problematic rating scale
Taken together, the 15-item BISA (Brief Inventory of Swallowing Ability) was derived as shown in Table 6 (refer to Appendix 1 & 2 for the evaluation sheets of English and Korean versions, respectively). The rating scale is divided into three categories, 0 (never), 1 (sometimes), and 2 (often) depending on frequency domain. Severity was categorized into 0 (never), 1 (moderate), and 2 (severe). The total score ranges from 0 (no impairment) to 30 (most severe disability).
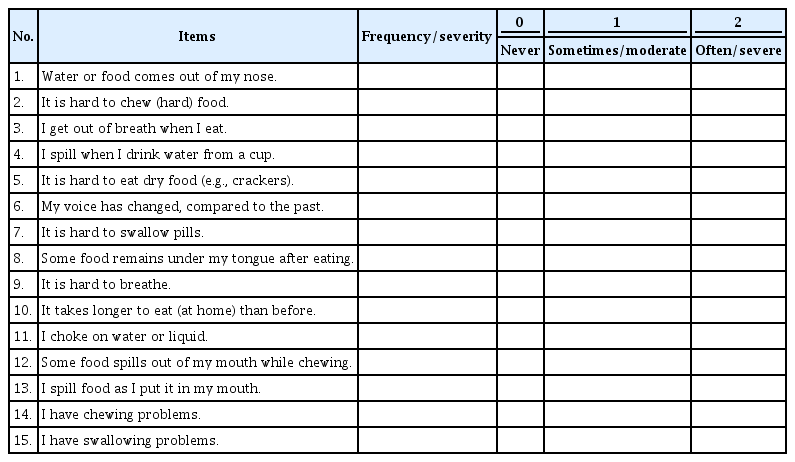
The 15-item Brief Inventory of Swallowing Ability (BISA-15)
CONCLUSION
This study was aimed at validating a pre-developed self-reported questionnaire (Kim et al., 2018, 2019) to assess swallowing functions for community-dwelling older adults via the Rasch analysis. The questionnaire demonstrated a one-dimensional tool based on the dimensionality and item fit statistics. The overall item reliability was excellent, within the suitable parameters. The person reliability was, however, rather lower than the required criterion of 3, because of a small variation in the swallowing performance among the aged individuals. This issue could be resolved if a wide range of age group is included in the study because “oldest older” adults, aged 85+ years, could exhibit severe forms of swallowing problems (Inuma et al., 2017). The rating scales revealed disorder, indicating that consideration should be given to collapsing categories and a re-analysis done depending on the frequency distribution.
To determine the item fit statistics, the infit and outfit MNSQ statistics were calculated, which specify how well each item fits the Rasch model. In our study, a total of 11 items were mis-fitting: Four items had high MNSQ values showing that these items were not homogeneous with the other items, while 7 indicated low MNSQ values implying that the items were duplicates of the others (Bond & Fox, 2015). These items might have exhibited a ceiling effect in healthy older adults (Cordier et al., 2017). The most frequently reported item, “I have chewing problems” had been often reported in literature over the past decades (Ikebe et al., 2012; Takagi et al., 2017). In a similar vein, “My voice has changed compared to the past” was revealed as one of the more frequent complaints among older adults (Martins, Gonçalvez, Pessin, & Branco, 2014). Voice change may be ascribed to a laryngeal dysfunction in older adults (Lee, Choi, Choi, & Kim, 2018), resulting in frequent aspiration and/or choking (Zhang et al., 2016). On the other hand, the least observed items, “Water or food comes out of my nose” and “I get out of breath when I eat” might imply an underlying pathology impacting swallowing functions.
As a result of the analysis of the dimensionality, the Rasch dimension explained 40.1% of the variance in the data, with 40% is being considered as a strong measurement of dimension (Cordier et al., 2017). However, the eigenvalue of the 1st contrast was 2.84, which is slightly above the expected value (Linacre, 2019b). Therefore, we further investigated into the disattenuated correlations between the person measures in the clusters of items. The disattenuated correlations of our data were all 1.0, indicating that, statistically, all the clusters of items were measuring the same thing (Linacre, 2019b). Thus, we could conclude that the BISA-15 is reasonably unidimensional.
The Rasch model reliability was assessed by using reliability of the person separation. In this study, people were classified using a person strata because the outlying measures were considered for true performances. PSI/strata in our data was 2.24, which is slightly lower than the required criterion of 3. This finding suggested that people were not being separated into at least three levels (high, medium, low) of ability. The reason for low person reliability could be the need for more items to separate the high and low performances, or to introduce a broader sample of people ability (Linacre, 2019b). In this paper, the interpretation is that there was a small variation in the swallowing abilities of the community-dwelling older adults.
Finally, the rating scale confirmed problems in the average measures, outfit MNSQ, and step calibration. The first obvious issue was in category 4 which had only 95 observations in all. This meant that severe swallowing problems were not well reported in the community-dwelling elderly of the current study. The very low count in comparison to all others must be a reason for caution. This issue was reflected in the average measure values and outfit MNSQ. The average measures for category 3 and 4 were disordered, and the outfit MNSQ of category 4 was above the threshold. There was also evidence that the interval between the thresholds calibration was too small, demonstrating no distinctive difference in the swallowing functions between the older adults. One potential solution would be trying collapsing the rating scale categories. If category 3 and 4 were dropped into category 2 (e.g., 01222 then 01234) in consideration of the uniform frequency distribution, our rating scale diagnostics may be expected to improve.
The BISA-15 is a clinically useful tool that can be utilized to screen older adults with swallowing and/or chewing difficulties in larger community settings and public health programs since it requires minimal training to administer and is easy to score, and therefore can rapidly screen large numbers of persons. Based on the results of this study, there are several areas of research that can be identified for the continued development of the BISA-15. The first relates to setting the cut-off score, which is expected to be specifically useful for swallowing screening in older people. Another important area for further development would be testing the reliability and validity of the rating on other clinical groups, such as those with strokes and movement disorders.
In summary, these evidence-based items of protocol of the current study are promising in that they support the importance of study subject specificity. Although various patient groups had been targeted in most of the currently available swallowing evaluation protocols, this protocol is focused on community-dwelling older adults. The items of the current research can be utilized to detect degree of aberrations in swallowing that transit from normal to subclinical stage. Future research is warranted to further clarify the validity of these items in a large cohort study.
References
Appendix
Appendix 1.
The 15-item Brief Inventory of Swallowing Ability (BISA-15) (English version)
csd-25-2-489-app.pdfAppendix 2.
The 15-item Brief Inventory of Swallowing Ability (BISA-15) (Korean version)
csd-25-2-489-app.pdf