


The human brain may perceive a gradual change of a sensory variable as discrete categories, not as continuous change. This is called categorical perception because a great amount of continuous sensory input is processed into a fixed abstract category rather than detailing the physical reality itself in the brain. Thus, two pairs of stimuli having the same absolute physical differences can be placed into the same or different categories by the category system represented in the brain. Also, the discrimination between stimuli can be better when they are across different categories than when they are within the same category. Categorical perception helps the brain process efficiently by picking up important information only, ignoring unnecessary information (Harnad, 1987, 2003; Liberman, Harris, Hoffman, & Griffith, 1957). Categoricallike perception is well known as an information process in human cognitive activity. Computational modeling has shown that both competitive networks and back-propagation systems show processes similar to categorical perception (Damper & Harnad, 2000). This pattern of information processing occurs on various sensory stimuli varying along a continuum (Bornstein & Korda, 1984; Etoff & Magee, 1992; Young et al., 1997). In particular, category perception of speech has been studied widely to examine the speech process since Liberman et al. (1957) revealed a synthetic /ba/-/da/- /ga/ continuum was perceived categorically, not continuously.
Studies accumulating neural data correlated with categorical perception have employed event related potentials (ERPs). ERPs refer to the electrical voltages elicited in the brain in response to some specific events or stimuli (Blackwood & Muir, 1990). ERPs have been one of the most powerful tools of examining cognitive processing of sensory information in the brain. The ERP components are defined by amplitude and latency. Amplitude is measured in microvolts by quantifying the maximum or minimum peak of voltage generated after the stimulus is presented, while the latency is obtained in milliseconds (ms) by measuring the time taken until the response is elicited after the stimulus is presented. ERPs— with the advantages of its high temporal resolution, noninvasive procedure, and relatively inexpensive cost— have contributed to the investigation of the changes of neural representation in the brain with the advantages of its high temporal resolution, noninvasive procedure, and relatively inexpensive cost. Thus, ERPs have been used in studying neural activity associated with a variety of speech and language processing tasks (Mueller, 2005). Behavioral tests of speech perception provide only the information about the final results of the whole speech perception processing, which cannot unveil the fundamental neural mechanism and subprocess underneath the end response. ERPs would be helpful in clarifying the observed speech and language outcomes by elucidating possible cortical neurophysiologic processing. Also, ERPs could be a viable option to evaluate speech perception for those who have difficulty in performing behavioral response due to physical or motor-skills problems or for those whose traditional behavioral performance is not enough to explain the outcomes in reality.
The P300 is one of the most robust and reliable peaks in the ERP repertoire (Patel & Azzam, 2005). Since the P300 was first described (Sutton, Braren, Zubin, & John, 1965), it has been widely used as a method of monitoring brain responses. Though the P300 is elicited at around 300 ms after stimulus onset, the latency can be recorded as late as 600 ms depending on the stimuli or events necessary performing some specific cognitive processes (Hall, 2007). The P300 is commonly elicited by an oddball paradigm in which a deviant stimulus with low probability of presentation is presented randomly in a series of a standard stimulus with high probability of presentation. The amplitude of P300 becomes greater as task demand or difficulty is reduced, while the latency of P300 becomes shorter as speed of information processing is increased (McPherson, Ballachanda, & Kaf, 2000; Polich, 2007). Whereas the P3a, an involuntary subcomponent of P300, is robust over the frontal or fronto-central scalp areas, the P3b, a voluntary response elicited by the oddball paradigm, has centro-parietal scalp topography (Bennington & Polich, 1999; Duncan et al., 2009). The current study follows the conventional referral of the P3b as the P300 response.
Numerous studies have suggested that the P300 can be a clinical tool to evaluate auditory processing, measuring the P300 in a variety of patients with hearing impairment, developmental dyslexia, language disorders, learning disability, attention deficit hyperactivity disorders (ADHD), Alzheimer's disease, schizophrenia, etc. (Alvarenga, Araújo, Ferraz, & Crenitte, 2013; Groenen, Beynon, Snik, & van den Broek, 2001; Hutchinson & McGill, 1997; Jeon & Polich, 2003; Purdy, Kelly, & Davies, 2002; Salamat & McPherson, 1999; Wible, Nicol, & Kraus, 2005). Groenen et al. (2001) reported that the prolonged P300 in cochlear implant users compared to people with normal hearing suggests that the P300 provides additional information about speech perception upon behavioral speech recognition testing. Alvarenga et al. (2013) examined the therapeutic effectiveness of a phonological remediation program, using the P300 and a phonological awareness test. Their results showed that the children with developmental dyslexia who received a phonological remediation program showed greater responses on the phonological awareness test and a shorter P300 latency compared to the control group with no phonological remediation program. In conjunction with behavioral methods, electrophysiological methods have contributed to the integrated understanding about of speech perception. Speech perception is a very dynamic and complex mechanism associated with auditory, linguistic, and cognitive processing. Collaborated approaches using both behavioral and electrophysiological measures could provide more detailed information about speech perception for differential diagnoses, monitoring, and rehabilitation of people with auditory processing problems (Horev, Most, & Pratt, 2007). In spite of the possibilities of clinical utility of the P300, however, the methods and procedures for the its clinical application have not yet been standardized. Thus, with the technical advances, further studies are required to get better insight into speech perception on the P300 (Duncan et al., 2009; Kalaiah & Shastri, 2016).
A lot of researchers have examined the extent of P300 sensitivity to perceptually deviant contrasts and the association of P300, by varying the physical features of auditory stimuli. Tone bursts have been most commonly used as stimuli to elicit the P300. Using 1,000 Hz standard stimuli and 2,000 Hz deviant stimuli, Purdi et al. (2002) showed that the P300 amplitude was reduced and the P300 latency was prolonged in people with learning disabilities. To study how the P300 and behavioral performance are associated, White, Stuart, & Najem (2010) constructed behaviorally perceptible tone contrasts and imperceptible tone contrasts. In a listening oddball paradigm, they reported that the P300 was elicited by behaviorally discriminable tone contrasts while no P300 was elicited by behaviorally imperceptible tone contrasts. Their results showed that the P300 is sensitive to stimulus probability and P300 has good correlation with behavioral performance when tone stimuli were used as stimuli. Kalaiah & Shastri (2016) studied P300 elicited at Fz, Cz, C3, C4, and Pz, using puretones and tones with frequency changes. They demonstrated that rising tone-complexes elicited the P300 with larger amplitude and shorter latency, possibly due to the larger magnitude of frequency change than falling tone-complexes and perceptual bias for approaching sounds as a warning cue in natural environment.
On the other hand, a variety of speech stimuli have been used to evoke the P300 elicited. Lew, Slimp, Price, & Massagli (1999) used the word of ‘mommy’ as the deviant stimulus and 1,000 Hz tone as the standard stimulus to examine the P300 evoked by speech stimuli. Their results showed that the speech-evoked P300 was larger than tone-evoked P300 in patients with traumatic brain injury. However, the comparison of tone and speech-evoked P300 responses needs to be interpreted cautiously because the word stimulus of ‘mommy’ is the very easily discriminated from the 1,000 tone and can elicit the larger P300, regardless of tone versus speech-evoked responses. While non-meaningful syllable stimuli have been widely used in the study of speech evoked P300 (Groenen et al., 2001; Oppitz et al., 2015), some investigators have examined how the P300 is evoked by sub-phonemic speech stimuli (Dalebout & Stack, 1999; Dehaene-Lambertz, 1997; Horev et al., 2007; Maiste, Wiens, Hunt, Scherg, & Picton, 1995; Tampas, Harkrider, & Hedrick, 2005). Maiste et al. (1995) constructed two sets of stimuli where each set had 1,000 stimuli from a nine-step /ba/-/da/continuum. For one set of stimuli, /ba/ endpoint stimuli and the other eight stimuli were presented by 52% and 48% (6% each), respectively. For the other set of stimuli, /da/ stimuli and the other eight stimuli were presented by 52% and 48% (6% each), respectively. The results showed that the N200-P300 complex had greater amplitude for more improbable stimuli, suggesting it was sensitive to reflect the phonetic level. Tampas et al. (2005) measured the mismatch negativity (MMN) and P300 with discrimination data using both synthetic speech contrasts and non-speech analogous acoustic contrasts as stimuli. Their results showed that MMN was elicited by non-speech stimuli only and that the P300 was elicited by both non-speech and speech stimuli, and electrophysiological data were associated with discrimination accuracy.
Based on the results of previous studies, the present study used consonant-vowel (CV) stimuli straddling the phoneme category boundary as stimuli to examine whether the P300 is sensitive to subtle phonetic changes. The present study replicates and extends the preliminary study (Lee, 2012) by doubling participants, measuring over wider scalp areas, and combining behavioral and ERP measures. Findings from this earlier study showed that the P300 was elicited by across-category stimuli, P300 amplitude was larger for greater deviancy of stimuli, P300 latency was not significant for the deviancy of stimuli, and P300 was larger over central and parietal regions than frontal region. Limitations of this study included a small number of subjects (N=10) as well as limited scalp recording sites (Fz, Cz, and Pz) and no behavioral data. In addition, there were no significant effects of P300 latency that were observed, contrary to earlier studies. The current study sought to confirm the stimulus-based results of the preliminary study while boosting the chance to observe latency effects by doubling the subject (N= 20). To determine whether scalp distribution was accurately assessed in the previous study, the current study tripled the recording sites from three to nine (including now F3, Fz, F4, C3, Cz, C4, P3, Pz, and P4). It is possible that the expanded recording sties may show a different response distribution, perhaps showing evidence of frontal lobe activity affecting or modulating the P300 response to speech contrasts. Finally, this study attempted to show how behavioral measures of accuracy response and reaction times occur for the deviancy of stimuli in discrimination task and might be related to P300 amplitude and latency measures. Thus, our aim in the current study was to examine in depth the nature and characteristics of the P300 response reflected in the processing of across-category speech stimuli by determining whether (1) the P300 is different for the extent of deviancy of stimuli and a scalp distribution, (2) the behavioral response is different for the extent of deviancy of stimuli, and (3) the P300 is correlated with the behavioral response.
METHODS
Subjects
Twenty native English speakers (male 8, female 12) served as subjects in the present study. The participants were ranged in age from 18 to 36 years old (mean= 23.3 years). All subjects were right-handed (Oldfield, 1971) and had no history of neurological or psychological disorders nor speech, language, or hearing disorders. Their audiometric thresholds were at or below 15 dB HL for the octave frequencies between 250 and 8,000 Hz (American National Standards Institute, 2004).
Stimuli
A nine-step series /bi/-/pi/ continuum was used as stimuli by manipulating voice onset time (VOT) from a male native English speaker's naturally-produced /bi/ syllable. The syllable was recorded in a quiet room, using a high quality microphone (Spher-O-Dyne) held approximately 5 cm the speaker's mouth, was saved as a file sampled at 44.1 kHz (CSRE version 4.5). This syllable was used as the prototypical /bi/ (Stimulus 1) with a VOT of 0 ms. To provide a more easily defined initial burst, and to aid in measuring VOT, the noise burst of a synthetic /pi/ was made and placed at the front of the /bi/ syllable. The noise burst portion increased in 8 ms steps so that the prototypical /pi/ (i.e., Stimulus 9) had a VOT of 64 ms (Adobe Audition version 1.5). Table 1 shows VOT of stimuli on a nine-step series /bi/-/pi/ continuum.
Table 1.
Voice onset time (VOT) of stimuli on a nine-step series/bi/-/pi/ continuum
|
Stimulus |
|||||||||
|---|---|---|---|---|---|---|---|---|---|
| 1 | 2 | 3 | 4 | 5 | 6 | 7 | 8 | 9 | |
| VOT (ms) | 0 | 8 | 16 | 24 | 32 | 40 | 48 | 56 | 64 |
From the results of labeling test on a /bi/-/pi/ continuum, one within-category CV and two across-category CVs were selected as stimuli. Stimulus 2 was used as the standard stimulus because it showed the greatest labeling performance. Stimulus 4 was used as weak deviant stimulus (WD) and Stimulus 5 as strong deviant stimulus (SD) because Stimulus 4 is was acoustically closer to the standard stimulus while Stimulus 5 is was acoustically farther from the standard stimulus. The details about determining the stimuli is described in Procedure section.
A total of 600 stimuli composed of 480 standard stimuli (80%) and 120 deviant stimuli (20%) with 60 for WD and 60 for SD were presented in an active oddball paradigm into two blocks. The presentation order of blocks was counterbalanced. Each block included 300 stimuli composed of 240 standard stimuli, 30 WD, and 30 SD. The stimuli were presented in pseudorandom sequences where the first deviant followed at least eight standard stimuli and no less than three standard stimuli continued after one deviant. Each stimulus was presented with a 1,100 ms inter-stimulus interval (ISI) to allow for measurement of response time. Subjects were given a 3-minute break upon the completion of each block.
Procedure
Prior to the experiment, all subjects signed informed consent statements, filled out a case history form, and received a hearing screening test.
Labeling test
To determine the speech stimuli in the oddball paradigm, a forced choice labeling test was administered prior to the EEG and discrimination test. For the labeling test, subjects were instructed to click the letter ‘b’ or ‘p’ on the computer screen by using a mouse. A total of 90 sounds were presented at a comfortable level (approximately 75 dB SPL) through headphones in a sound-treated booth. Each sound was presented 10 times in random order. The resulting averaged psychometric function from the labeling test was used to determine the standard stimulus, WD, and SD.
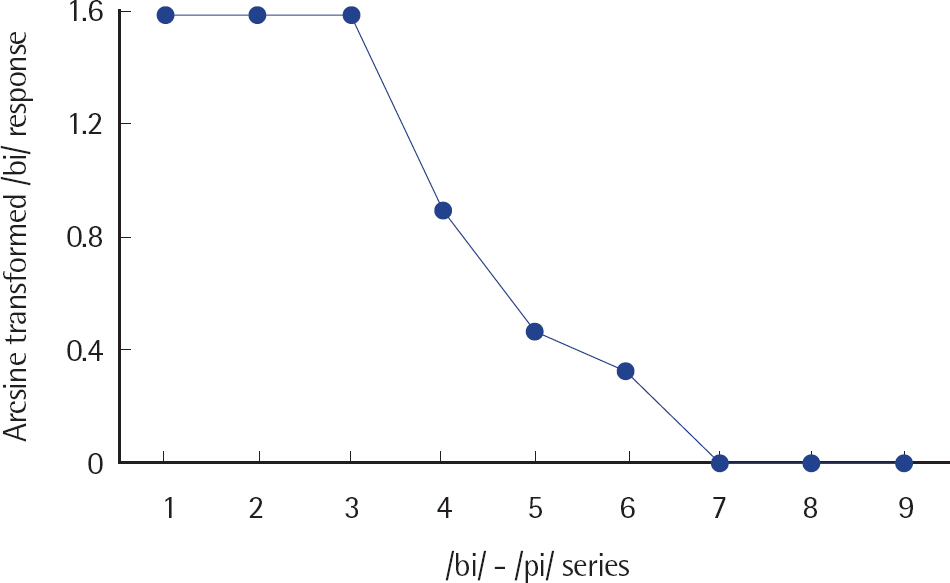
To analyze the mean /bi/ response, the percentage score of /bi/ response was converted by arcsine transformation. A one-way repeated measures analysis of variances (ANOVA) was conducted on the arcsine transformed /bi/ response with the deviancy condition (3 levels: standard, WD, SD) as the factor. Bonferroni corrections were used for any subsequent univariate testing.
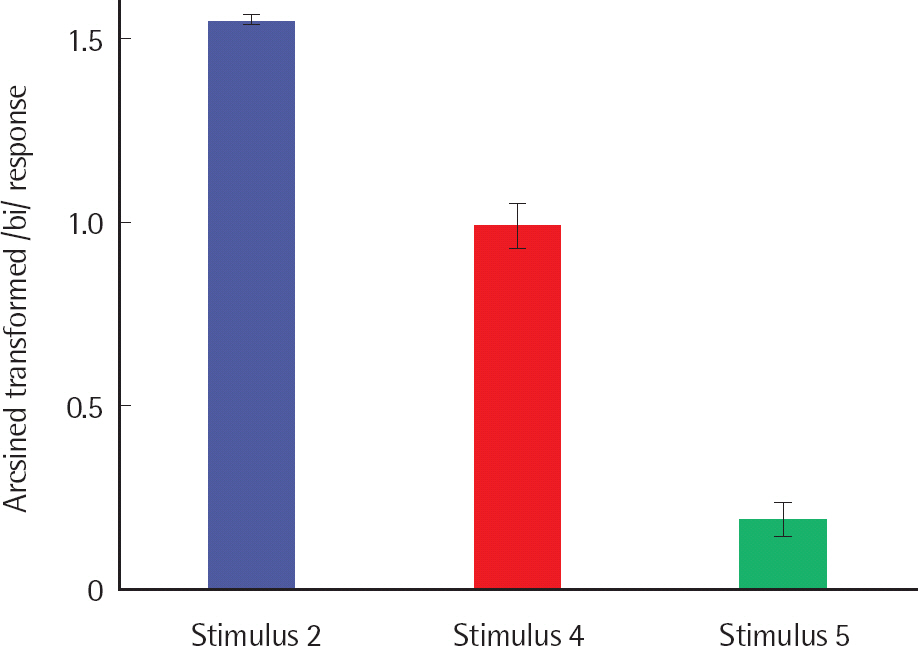
The labeling performance was different for deviancy condition with large effect size (F(2.911, 55.310) = 423.811, p< .001, ηp2 =.957) (Cohen, 1992). The /bi/ response for Stimulus 2 was significantly greater than Stimulus 4 and Stimulus 5, and Stimulus 4 was significantly greater than Stimulus 5. Thus, Stimulus 4 was used as WD, and Stimulus 5 as SD for the experiment. Figure 1 shows the /bi/ response for the /bi/-/pi/ continuum, and Figure 2 shows the /bi/ response for Stimulus 2 (standard stimulus), Stimulus 4 (WD), and Stimulus 5 (SD).
EEG & discrimination test
Subjects were seated comfortably in a reclining chair in a dark sound-treated booth, and given the response button. They were instructed to press the response button as soon as they heard a stimulus that sounded different from the frequently presented stimuli. EEG data were recorded using Compumedics NeuroScan Scan 4.3.3 software and SynAmps 2 system while speech stimuli were presented and behavioral responses were recorded using Compumedics NeuroScan STIM2. To ensure subjects can detect the deviant stimulus, they took part in the experiment only when their performance reached 100% on the preliminary test. The stimuli were presented binaurally through Etymotic ER-3A insert earphones at approximately 75 dB SPL, which is consistent with the loudness levels of normal conversation.
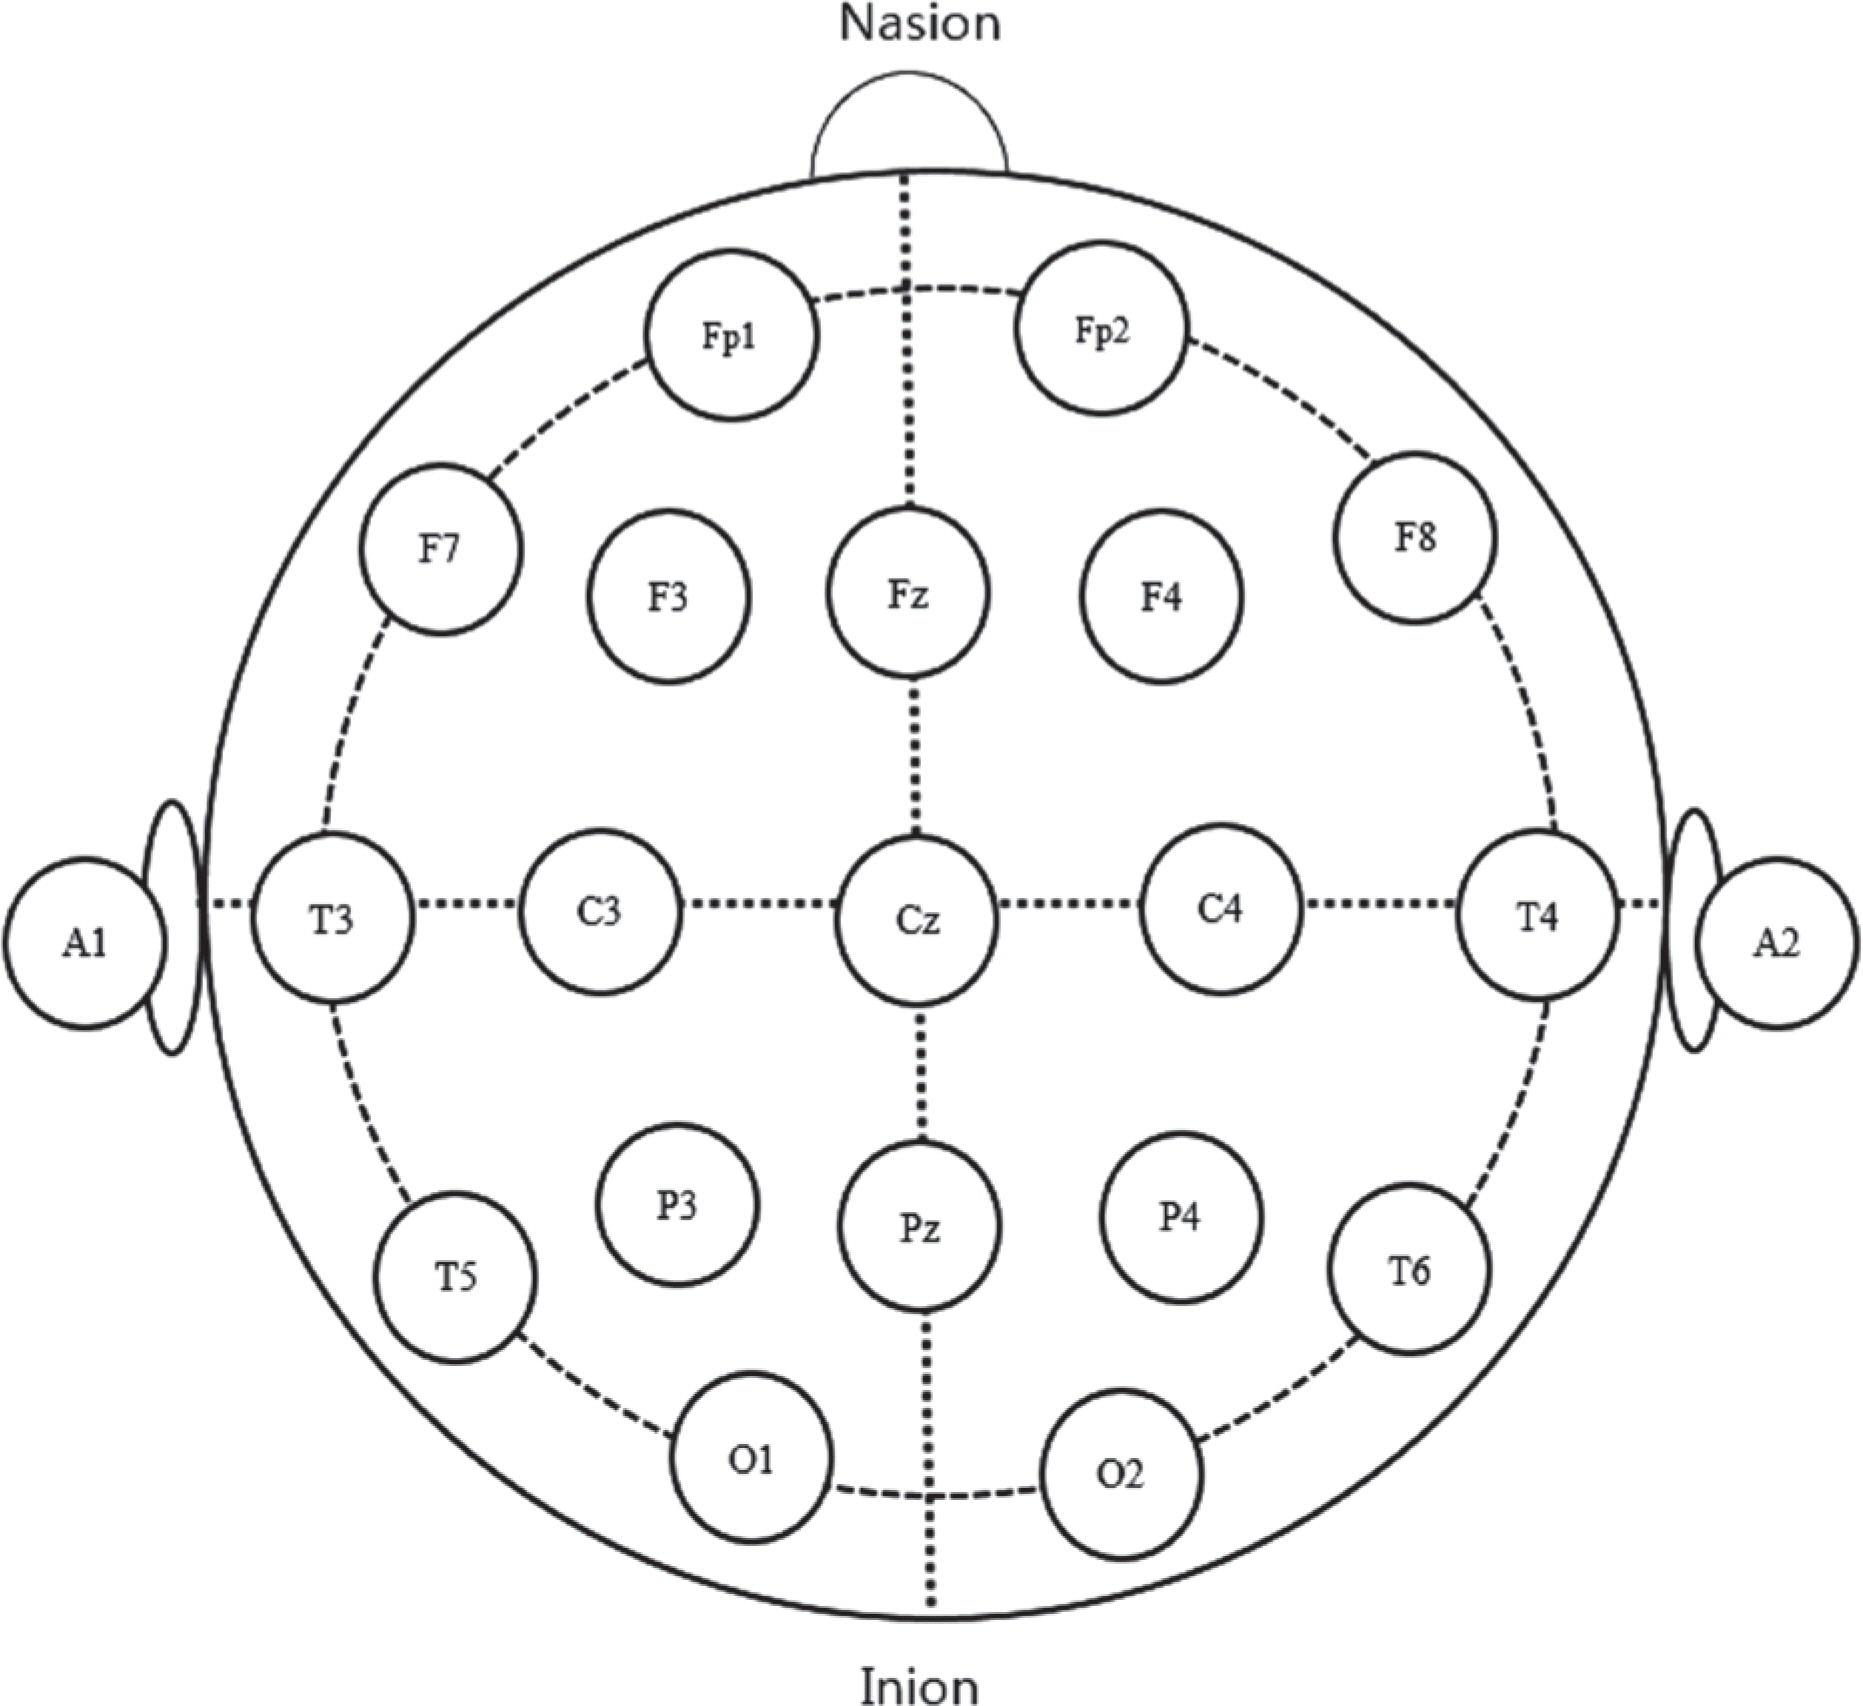
While subjects were responding behaviorally, EEG responses were acquired from F3, Fz, F4, C3, Cz, C4, P3, Pz, and P4 according to International 10–20 System (Jasper, 1958). Figure 3 shows International 10–20 System. The electrodes were connected to a 64-channel NeuroScan system, referenced by the cap electrode between Pz and Pcz and grounded by the cap electrode at Fpz. Also, to measure vertical and horizontal electrooculograms (EOGs), the electrodes were placed above, below, and on the inner and outer canthi of the left eye. All electrodes were Ag/AgCl. During data collection, impedance was maintained at 5 kΩ. The continuous EEG recordings were obtained for 100 ms before and 1,000 ms after the stimulus onset, using a bandpass of 0.01–30 Hz and digitally sampled at 500 Hz. Only data associated with correct behavioral response, EOG less than 70 μ V, greater than 40 averaged responses in each deviancy condition were included for further analysis. An offline re-reference was administered. Grand average waveforms were derived from averaging all individual waveforms.
Data Analysis
P300 response
All post-stimulus data points were adjusted automatically relative to the average amplitude of the pre-stimulus baseline. The P300 amplitude and latency were measured on the deviant waveforms. Two two-way repeated measures ANOVAs were conducted on the P300 amplitude and latency, respectively, with the deviancy condition (2 levels: WD, SD) and scalp distribution (3 levels: frontal region, central region, parietal region) as the factors. For the analysis of the scalp distribution on the P300 amplitude and latency, the data from three electrodes on each scalp region were averaged. For example, the data for the frontal region was averaged from F3, Fz, and F4. When Mauchly's test of sphericity was significant, Greenhouse-Geisser adjusted degrees of freedom, F- and p-values were reported. On the use of multiple ANOVAs, Bonferroni adjustments were used such that an alpha level of .025 (.05/2) was considered significant. Bonferroni corrections were applied to all posthoc tests performed.
Behavioral response
For behavioral performance, accuracy response and reaction times were measured. Accuracy response was analyzed on the arcsine transformed score of the percentage of correct responses. Reaction times were analyzed on the time (ms) between the triggering point of the auditory stimuli and the moment participants pressed the response button. Two one-way repeated-measures ANOVAs were conducted on accuracy response and reaction times with context condition (2 levels: WD, SD) as the factor, respectively. On the use of multiple ANOVAs, Bonferroni corrections were applied such that an alpha level of p < .025 (.05/2) was considered. Bonferroni corrections were applied to all post-hoc tests performed.
Correlation between P300 and behavioral responses
The correlation between P300 and behavioral data was analyzed, using Pearson product-moment correlations between P300 amplitude, P300 latency, accuracy response, and reaction times. On the use of multiple bivariate correlations, Bonferroni corrections were used such that an alpha level of p < .017 (.0125/4) was considered.
RESULTS
P300 Response: Amplitude and Latency
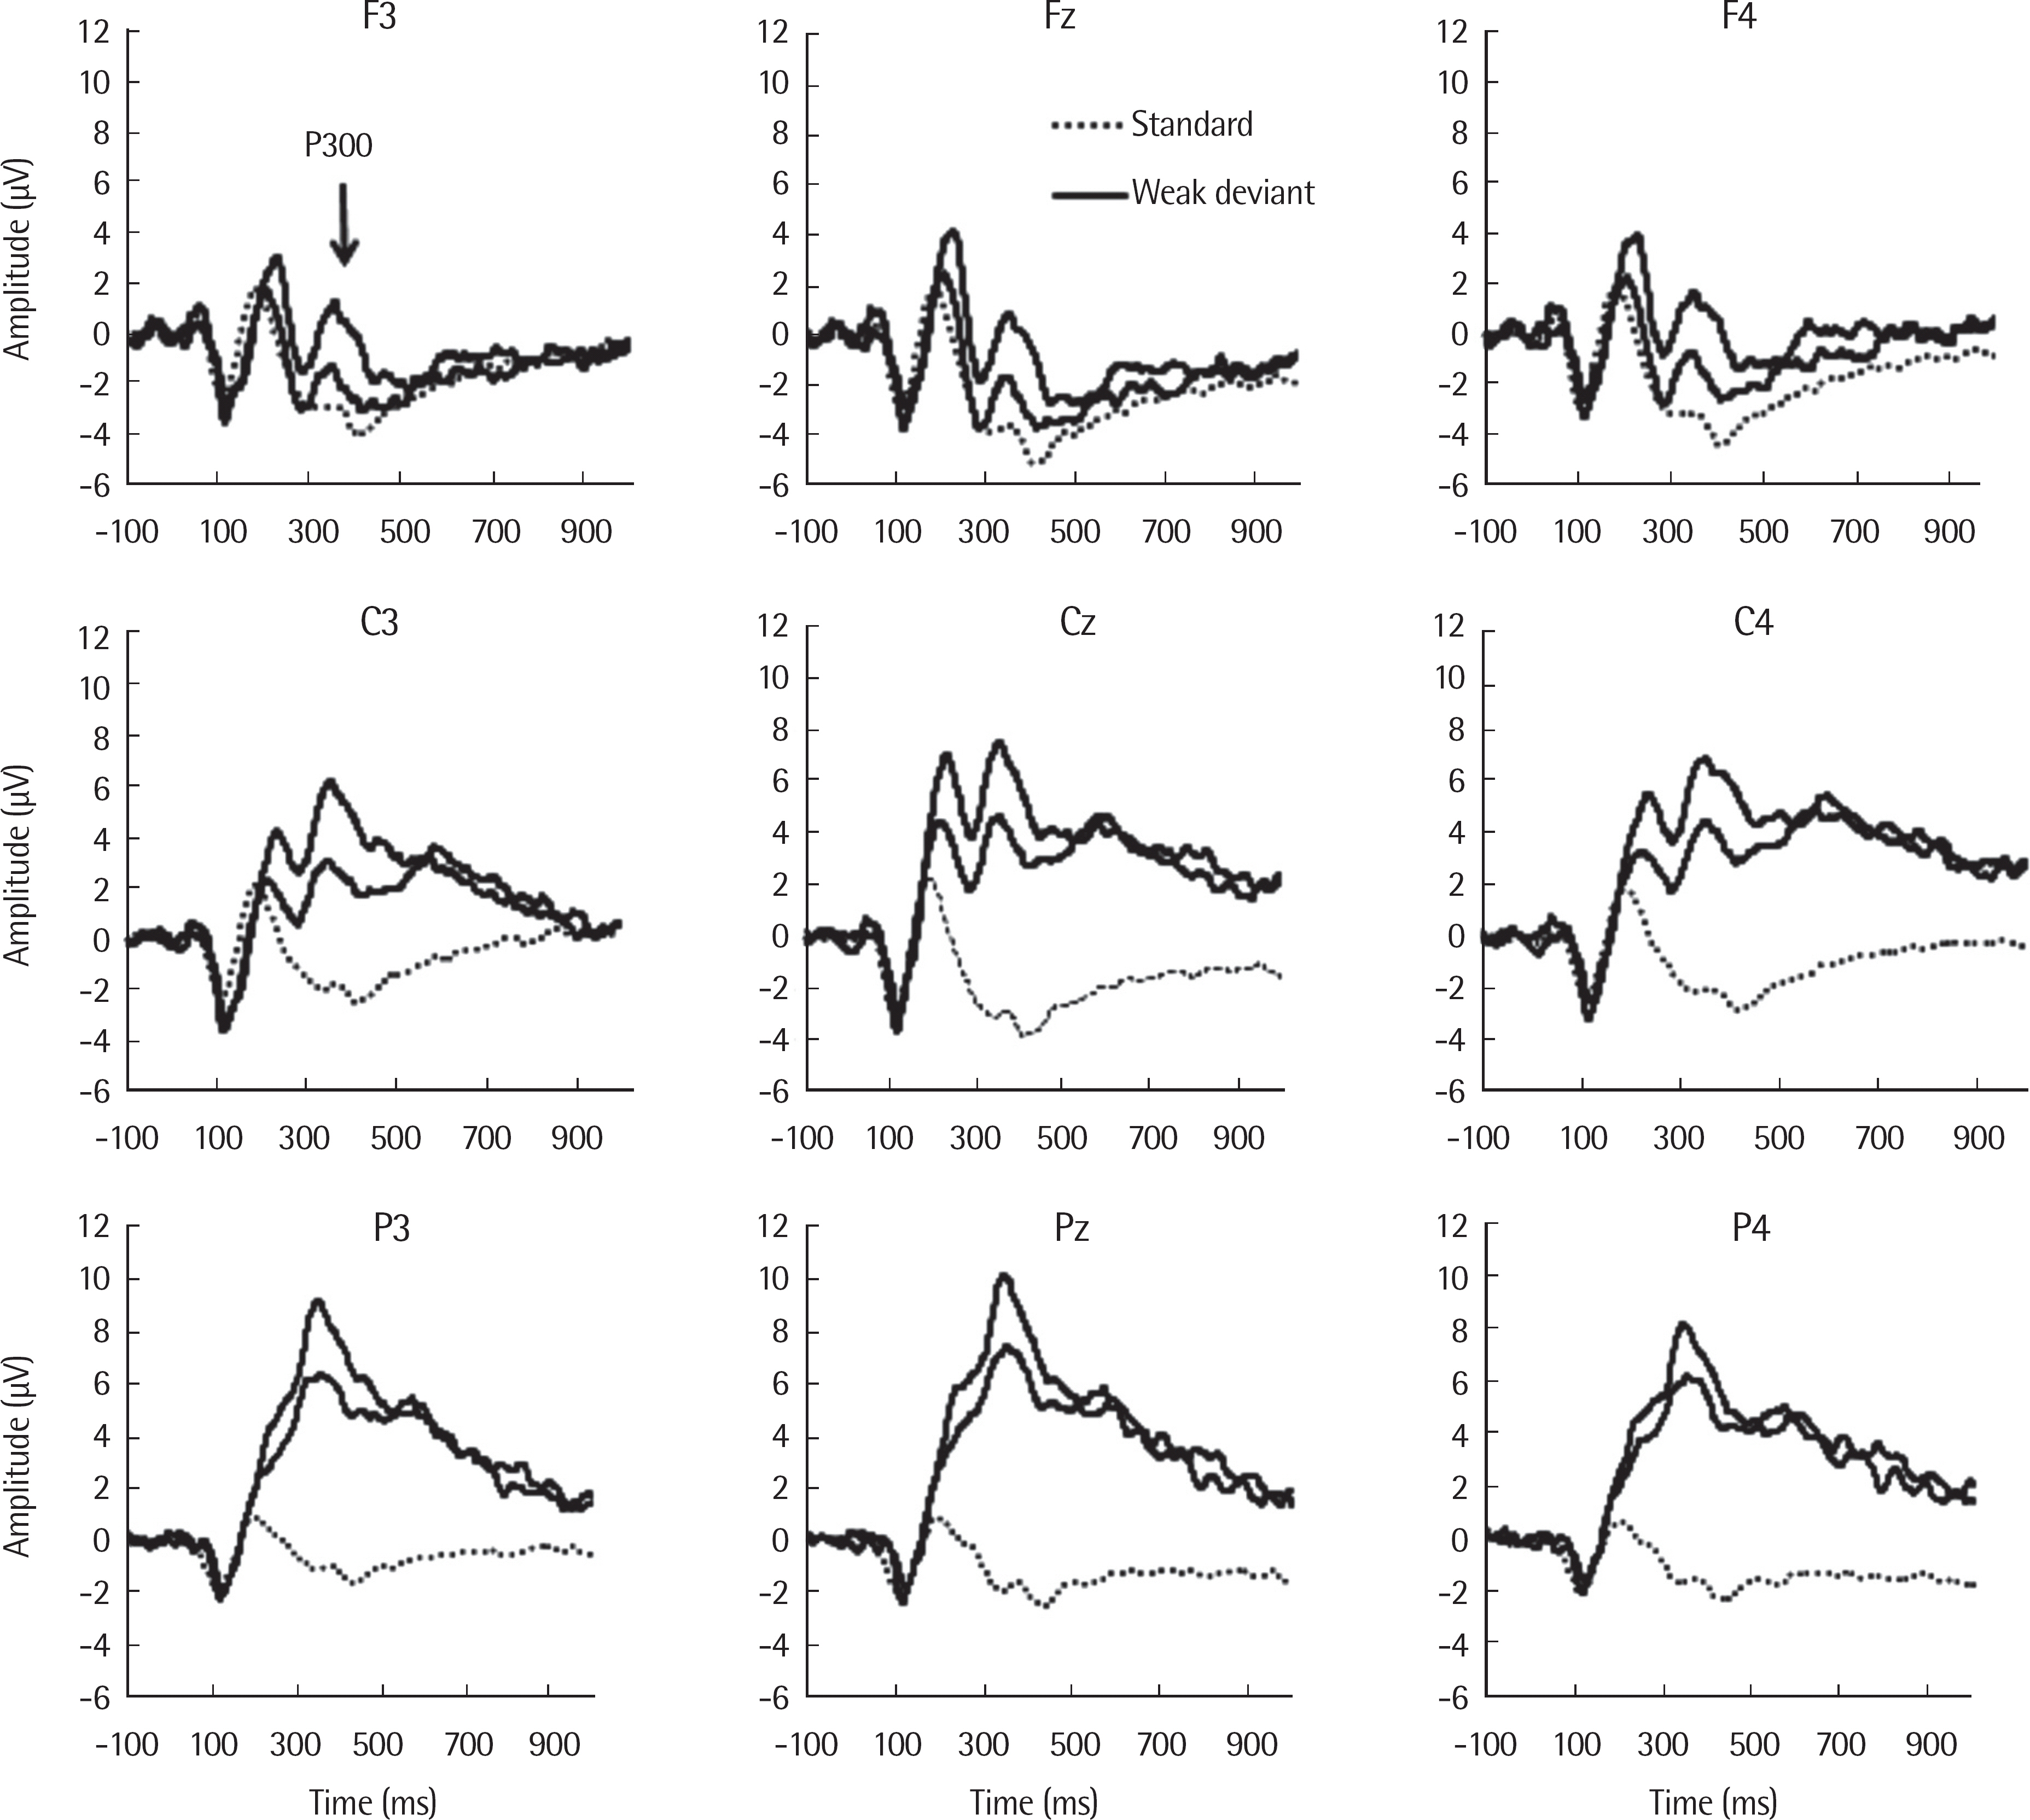
A robust P300 response was elicited by both deviant stimuli (WD, SD) on the overall scalp distribution. The P300 amplitude was significantly different for deviancy condition (F(1.,19) = 21.810, p < .001, ηp2 =.534) and for scalp distribution (F(1.553,29.515) = 77.345, p < .001, ηp2 =.803), respectively (Cohen, 1992). The P300 amplitude was larger for SD than for WD and was larger over central and parietal regions than the frontal region. There was no significant interaction of deviancy condition and scalp distribution. Table 2 shows P300 amplitude (µV) by scalp distribution. The P300 grand average waveforms are presented in Figure 4.
Table 2.
P300 amplitude (μV) by scalp distribution
Figure 4.
The P300 grand average waveforms. The P300 for the standard stimulus condition is dotted, the WD condition is thin, and the SD condition is bold line. WD=weak deviant stimulus; SD=strong deviant stimulus.
The P300 latency was significantly different for deviancy condition (F(1.,19) = 5.924, p =.025, ηp2 =.238) while it was not significantly different for the scalp distribution. The P300 latency was shorter for SD than for WD. There was no interaction of deviancy condition and scalp distribution. Table 3 shows P300 latency (ms) by scalp distribution.
Table 3.
P300 latency (ms) by scalp distribution
Behavioral Response: Discrimination Accuracy Response and Reaction Times
For discrimination data, both accuracy response and reaction times were significantly different for the deviancy condition. Accuracy response was significantly greater for SD than WD (F(1.,19) = 24.435, p < .001, ηp2 =.563). Reaction time was significantly faster for SD than WD (F(1.,19) = 21.052, p < .001, ηp2 =.526). The results of accuracy response and reaction times are shown in Figures 5 and 6. Table 4 shows the mean and standard deviation of accuracy response and reaction times by individual.

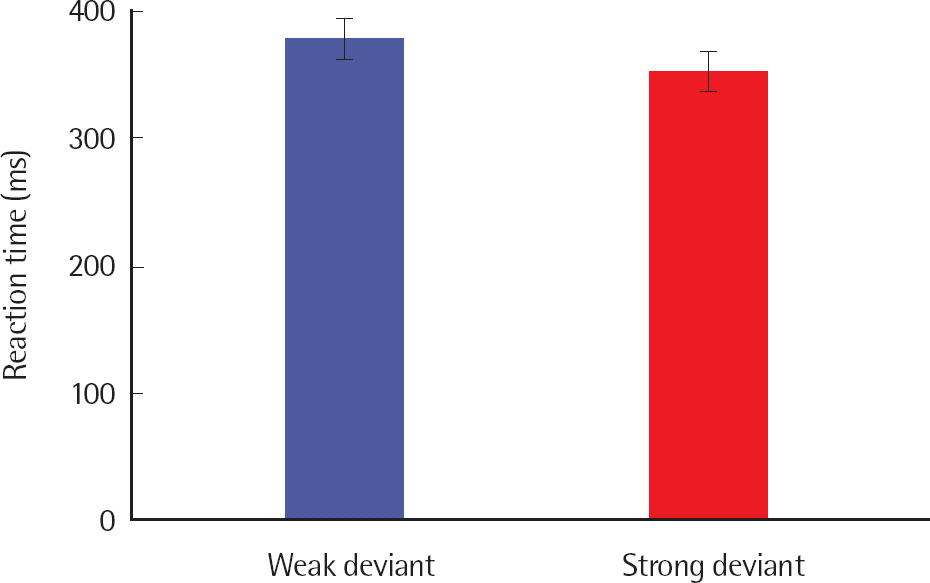
Table 4.
Discrimination accuracy response and reaction times by subject
Correlation between P300 and Behavioral Responses
P300 amplitude had significantly negative correlation with reaction times (r = −.471, p =.002) and P300 latency had significantly positive correlation with reaction times (r =.502, p =.001) while the other correlations were not significant. Table 5 shows the results of the bivariate correlation with Pearson correlation coefficient.
DISCUSSION & CONCLUSION
The P300 amplitude was sensitive to the degree of deviancy of across-category stimuli. The P300 was significantly larger for SD than for WD, suggesting that the P300 can reflect subtle perceptual processing at the sub-phonemic level. It may be because SD is perceptually more deviant from the standard stimulus than WD, and P300 is more sensitive to the more improbable stimuli. The P300 is very sensitive to stimulus probability and task difficulty (Folstein & Van Petten, 2008). The less demanding the task is, the greater the P300 amplitude (Polich, 2007). P30 amplitude is known to reflex neural changes in brain activity when new sensory input are presented, which is sensitive to the amount of central nervous system activity engaged with incoming information processing during a specific task (Johnson, 1993; Polich, 2004). Also, the P300 amplitude was significantly larger over the central and parietal regions than the frontal region, even with expanded recording sites. These findings were in line with previous findings in that it occurred maximally over the centro-parietal areas (Folstein & Van Petten, 2008; Martin, Tremblay, & Korczak, 2008; Picton, 1992).
The P300 latency was significantly shorter for SD than for WD, though it was not significant with smaller subjects (N=10) in the preliminary study. It is in line with some studies that reported longer P300 latency for more difficult tasks (Fitzgerald & Picton, 1983; Johnson & Donchin, 1980). This findings show that the shorter P300 latency for SD is associated with faster speed of information processing on easier tasks. P300 latency is different from the behavioral reaction times because the latency is a motor-free measure of the cortical nervous system (Duncan-Johnson & Kopelll, 1981). The P300 latency is known to index the speed for stimulus evaluation processes and the prolonged latency has been attributed to a lack of neural synchrony with increase in task difficulty (Henkin, Kishon-Rabin, Gadoth, & Pratt, 2002; Kalaiah & Shastri, 2016).
The P300 is engaged with conscious cognitive process and correlated with behavioral performance (Dalebout & Stack, 1999; White et al., 2010). In analogy with the results of P300 amplitude and latency, accuracy response was greater and reaction times were faster for SD than for WD, probably because discrimination of SD from the standard stimulus is associated with less processing demand compared to discrimination of WD from the standard stimulus. Using tone stimuli, White et al. (2010) showed all participants yielded P300 responses to perceptible contrasts with no response to the imperceptible contrasts. Also, there was significant correlation between P300 and reaction times. The results suggests that behavioral responses are related with the P300 amplitude and P300 latency, respectively, and reaction times is more sensitive to the association with the P300 rather than accuracy response. These correlational results suggest that the P300 more strongly reflects perceived certainty/uncertainty, with phonetic accuracy awaiting further refinement.
In summary, the P300 may reflect the subtle perceptual processing of phonetic changes, and the scalp distribution of the P300 is more dominant in the central and parietal regions versus the frontal region. Behavioral accuracy response was greater and reaction times were faster in less demanding tasks. Reaction times of discrimination were negatively correlated with the P300 amplitude, and positively correlated with the P300 latency.


