

The World Health Organization (2015) reported that 1.1 billion teenagers and young adults worldwide are at risk for developing hearing loss due to exposure to high levels of sound in noisy entertainment places and unsafe listening practices with personal listening devices (PLDs). College students are involved in various non-occupational voluntary activities in noisy environments such as nightclubs, concerts, and sporting events (e.g., Berger, Neitzel, & Kladden, 2015). Moreover, during the past few decades, college students’ use of PLDs has increased explosively with the release of MP3 devices and the popularity of new media platforms (e.g., Kreisman, Longenbach, Blasi, Fligor, & John, 2019). Many studies have investigated potential damage to hearing that may be attributed to college students’ involvement in activities in noisy environments (e.g., Balanay & Kearney, 2015; Widén, Holmes, & Erlandsson, 2006) and use of PLDs (e.g., Danhauer et al., 2009; Gopal, Champlin, & Phillips, 2019). In South Korea, the incidence rate of noiseinduced hearing loss (NIHL) in 100,000 population has drastically increased by 78.2% between 2005 and 2008 with the highest incidence rate being in those in their early 20s (Jeon, Choi, & Sakong, 2013). You, Kwak, and Han (2020) found that approximately 77.2% of 1,009 Korean college students reported being exposed to noisy environments, and that the use of PLDs was one of the most common causes of hearing difficulties.
NIHL occurs when people are exposed to sounds at over 85 dBA for more than 8 hours at a time and it can occur from a single loud blast for a short period of time or from gradual exposure to loud noise over time (NIDCD, 2019). When people are exposed to loud noise, they can experience a variety of hearing symptoms and hearing loss. People cannot hear or understand someone close to them, may have muffled hearing, experience soreness of ear, or ringing in their ears (i.e., tinnitus) after they hear the noise. In addition, they may experience limited concentration due to noise, have increased sensitivity to environmental sounds, and worry before attending noisy activities due to previous experience with auditory problems. Many college students reported that they had at least one hearing symptom including ear pain after noise exposure, sensitivity to noise, temporary or permanent tinnitus, worry, and selfreported hearing loss (Balanay & Kearney, 2015; Rawool & Colligon-Wayne, 2008; Widén et al., 2006; Widén, Holmes, Johnson, Bohlin, & Erlandsson, 2009).
Although NIHL is irreversible and cannot be cured, it can be prevented by using hearing protection in the presence of noise. Thus, aural (re)habilitation for NIHL needs to emphasize the use of hearing protection. The Health Belief Model (Rosenstock, 1974) postulates that how individuals perceive and experience a disease can influence whether they take a recommended preventative action. Exposing oneself to noise without hearing protection can be considered a risk-taking behavior, resulting in a hearing symptom. This negative consequence can act as a catalyst for transforming the individual’s risk-taking behavior into a more hearing protection using behavior (Bogoch, House, & Kudla, 2005; Keppler, Dhooge, & Vinck, 2015; Rawool & Colligon-Wayne, 2008; Widén et al., 2009).
The relationships between college students’ hearing symptoms, attitudes toward noise, and use of hearing protection have been investigated using self-report questionnaires, one of which is the Youth Attitudes to Noise Scale (YANS; Widén & Erlandsson, 2004). The YANS was developed in the Swedish language (Widén & Erlandsson, 2004) and adapted into several languages including American English, Portuguese, Chinese, Spanish, Serbian, and Korean (Widén et al., 2006; Zocoli, Morata, & Marques, 2009; Zhu et al., 2014; Degeest, Maes, Leyssens, & Keppler, 2018; Tomanic, Soldatovic, Jovanovic, Vukasinovic, & Maksimovic, 2020; Han & Kim, 2020, respectively) to evaluate youth’s attitudes toward noise after their exposure to noise in noisy environments. As far as our knowledge goes, this current study is the first study to have used the Korean-version YANS.
There are two differential findings in the studies that have used the YANS (the versions in languages other than Korean) on the relationship between hearing symptoms, attitudes toward noise, and the use of hearing protection depending on college students’ perception of noise produced in a given activity. On one hand, Widén and colleagues explored U.S. college students’ attitudes toward noise produced in activities such as rock concerts, festivals, and sports. Results showed an association between having experience with at least one hearing symptom and a negative attitude toward noise, but the association did not trigger the use of hearing protection (Holmes, Widén, Carver, & White, 2007; Widén et al., 2009). This is because the noise produced in those activities was considered enjoyable and acceptable and the use of hearing protection considered unnecessary. On the other hand, Balanay and Kearney (2015) investigated U.S. college students’ attitudes toward noise produced in activities such as lawn mowing and the use of firearms. Results demonstrated that the association between having experience with at least one hearing symptom and a negative attitude toward noise would lead to hearing protection use because the noise produced in those activities is widely considered harmful and the use of hearing protection is taken into consideration.
These findings suggest the importance of socio-cultural contexts in evaluating college students’ attitudes toward noise (Han & Kim, 2020; Widén et al., 2009) because these contexts can influence their use of hearing protection and even hearing status. For example, Keppler et al. (2015) study with young adults in Belgium found that college students with a negative attitude toward noise had significantly less hearing loss and used hearing protection devices more frequently than those who had positive attitudes, indicating that college students who don’t perceive noise as problematic tend to use hearing protection with less frequency and already have a more deteriorated hearing status. Studies with the YANS revealed that attitudes toward noise and self-reported hearing symptoms are important factors for understanding and influencing the use of hearing protection as a preventive health behavior.
However, little is known about how college students perceive and experience noise caused by unsafe listening practices with the PLDs they have been using for a long period of time and for long hours in a week (e.g., Marron et al., 2015), because the YANS studies (the versions in languages other than Korean) did not include question items relevant to the use of PLDs. As a result, little is known about whether college students’ attitudes toward noise from PLDs can lead them to use hearing protection. In contrast, the K-YANS was developed to fully reflect the primary causes of NIHL that college students encounter in their daily lives by including question items relevant to both exposure to high levels of sound in noisy environments and unsafe listening practice for PLDs.
The purpose of the current study was to examine the relationship between Korean college students’ hearing symptoms, their attitudes toward noise, and use of hearing protection. First, this current study aimed to identify what hearing symptoms college students experience in the presence of noise. Second, this study aimed to investigate whether there was a difference in attitude toward noise between those with hearing symptoms and those without hearing symptoms. In both situations: (1) when college students were exposed to high levels of sound in noisy environments; and (2) when they use their PLDs unsafely, it was hypothesized that those with hearing symptoms would perceive noise as more problematic (negative attitude toward noise) than those with no hearing symptoms based on the findings of the studies focusing on exposure to sound in noisy environments (Balanay & Kearney, 2015; Holmes et al., 2007; Widén et al., 2006, 2009).
Third, the current study aimed to explore whether their attitudes toward noise and self-reported hearing symptoms were associated with the use of hearing protection. There was a hypothesis made for each of the following two situations: (1) when college students were exposed to high levels of sound in noisy environments; and (2) when they use their PLDs unsafely. When college students were exposed to high levels of sound in noisy environments, it was hypothesized that their negative attitude toward noise and self-reported hearing symptoms would lead to the increased use of hearing protection based on the findings of Balanay and Kearney (2015) and Widén et al. (2006). When college students use their PLDs unsafely; however, it was hypothesized that the association between college students’ attitudes toward noise and their self-reported hearing symptoms would not lead to the increased use of hearing protection. This is because PLDs became part of college students’ necessaries and they perceived some noise as enjoyable and acceptable as seen in Holmes et al. (2007) and Widén et al. (2009). Thus, the use of hearing protection would not even be taken into consideration. The current study will provide insights into what factors may influence the change in college students’ behavior from a risk-taking behavior to a more health-oriented behavior, which can help college students prevent NIHL.
METHODS
Recruitment and Participants
Inclusion criteria for the current study were Korean college undergraduates between the ages of 18 and 30 who did not have problems with speech, language, hearing, physical, and medical development. An anonymous internet survey via the Qualtrics Insight Platform system was designed for survey research. The convenient and snowball sampling methods were used for recruitment. The survey flyer with the link to the survey Qualtrics website was e-mailed to a small number of college undergraduates who were willing to participate, and to the parents and relatives of college undergraduates and to a few professors who were willing to forward the survey to students. Students who received the survey flyer were encouraged to forward the survey link to any fellow students they knew of.
A total of 516 people participated in the online survey, of whom the individuals who did not fall in the age range from 18 to 30, were graduate students, had completed the survey multiple times, or had not completed all three sections (i.e., hearing symptom, the YANS, and hearing protection) were excluded from the study. Additionally, to verify their current enrollment at a college, those who did not respond to the question about either their college location or their grade were also excluded from the study. This exclusion process resulted in 278 college undergraduates with 62 males, 212 females, 1 other, and 3 with no responses. The average age of the 278 participants was 21.12 years (SD=2.61). Table 1 presents information on the participants’ age, gender, academic class standing, and college location. The participants did not receive any compensation for their participation in this survey. The current study was approved by the institutional review board.
Survey
The survey was designed to examine the relationship between Korean college students’ experience with hearing symptoms, attitudes toward noise, and use of hearing protection. Following the informed consent, the survey has four sections with 36 questions in total (See Appendix 1 for the complete survey). The first section of the survey prompted participants to answer questions on demographic information, including the participants’ gender, age, grade at school, major, city where the school is located, languages, vision, hearing, physical, and medical problems, and any experience with special education. In the second section, the survey focused on hearing symptom description including ringing/buzzing, ear fullness, hearing loss or muffled hearing, ear soreness, limited concentration due to noise, sensitivity to environmental noise, and anxiety before attending noisy activities due to previous experience with auditory problems. The third section of the survey asked the participants a question about the use of hearing protection. The last section focused on the K-YANS (Han & Kim, 2020). The K-YANS is a valid and reliable self-report measure for assessment of NIHL in college students. Note that the K-YANS not only adapted the English-version YANS (Widén et al., 2006) including the question items relevant to the youths’ exposure to high levels of sound in noisy entertainments, but also complemented them with new question items relevant to the youths’ listening practices with PLDs. The K-YANS consists of 16 questions, from which five questions ask about youth culture (Factor 1), six other questions ask about concentration (Factor 2), and the remaining five questions ask about PLDs (Factor 3). The question items in Factors 1 and 2 were taken from the English-version YANS and the ones in Factor 3 were newly generated for the K-YANS.
Coding and Interpretation of the K-YANS
A 5-point Likert scale was used ranging from “strongly agree (coded as 5)” to “strongly disagree (coded as 1)” for Question items 22, 25, 26, 28, 31, 34, and 35. Inverse coding was applied to Question items 21, 23, 24, 27, 29, 30, 32, 33, and 36 ranging from “strongly agree (coded as 1)” to “strongly disagree (coded as 5).” For example, if a student responded to Question item 21 with “strongly agree”, his or her response is coded as 1 instead of 5.
After coding the participants’ responses, the numbers obtained from all of the question items were added up together and grouped into three categories (i.e., a lower quartile, two middle quartiles, and an upper quartile) as the YANS studies have done since Widén and Erlandsson (2004) first used this same method, The criteria for each category were: a lower quartile (≤29), two middle quartiles (29< and ≤37), and an upper quartile (37<) for Factors 1 and 2 (noisy environments) and lower quartile (≤7), two middle quartiles (7< and ≤10), and an upper quartile (10<) for Factor 3 (use of PLDs).
Those whose scores fall within a lower quartile are identified as those with a negative attitude toward noise. They consider noise as something problematic. Those whose scores fall within two middle quartiles are identified as those with a neutral attitude toward noise, which is an indifferent attitude toward noise or uninformed of the possible consequences of noise exposure. Those whose scores fall within an upper quartile are identified as those with a positive attitude toward noise. They consider noise as something not problematic or dangerous. Thus, the lower the number, the more negative the youth’s attitude was toward noise, suggesting that noise is perceived as something that is problematic and should be avoided; the higher the number, the more positive the youth’s attitude was toward noise, suggesting that noise is perceived as acceptable, not problematic.
Data Analysis
Statistical analyses were conducted using statistical software R. First, to identify the students’ self-reported hearing loss, we used descriptive statistics that analyzed the students’ responses to the questions about hearing symptoms associated with noise exposure. Second, we used multinominal logistic regression in each of the two situations (noisy environments and use of PLDs) to investigate the association between the college students’ attitudes toward noise and hearing symptom after adjusting for age effect on the attitude toward noise. Third, we used logistic regression in each of the two situations to investigate whether the participants’ attitudes toward noise and their experience with hearing symptoms are associated with their use of hearing protection after adjusting for age effect on the attitude toward noise.
RESULTS
Hearing Symptoms
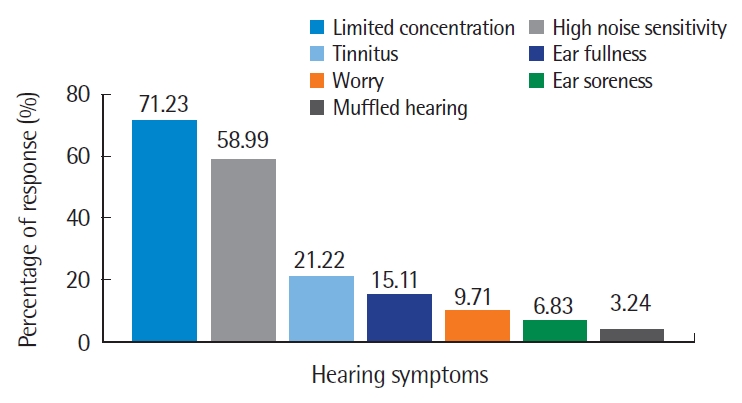
As seen in Table 2, only 44 students (15.83%) reported having no hearing symptoms while 234 students (84.17%) reported having at least one hearing symptom. Figure 1 illustrates the types of hearing symptoms reported by the 234 students, among which 71.23% of the students had experienced limited concentration and 58.99% high noise sensitivity. In addition, tinnitus (21.22%), ear fullness (15.11%), worry (9.71%), ear soreness (6.83%), and muffled hearing (3.24%) were reported.
Hearing Symptoms and Attitudes Toward Noise
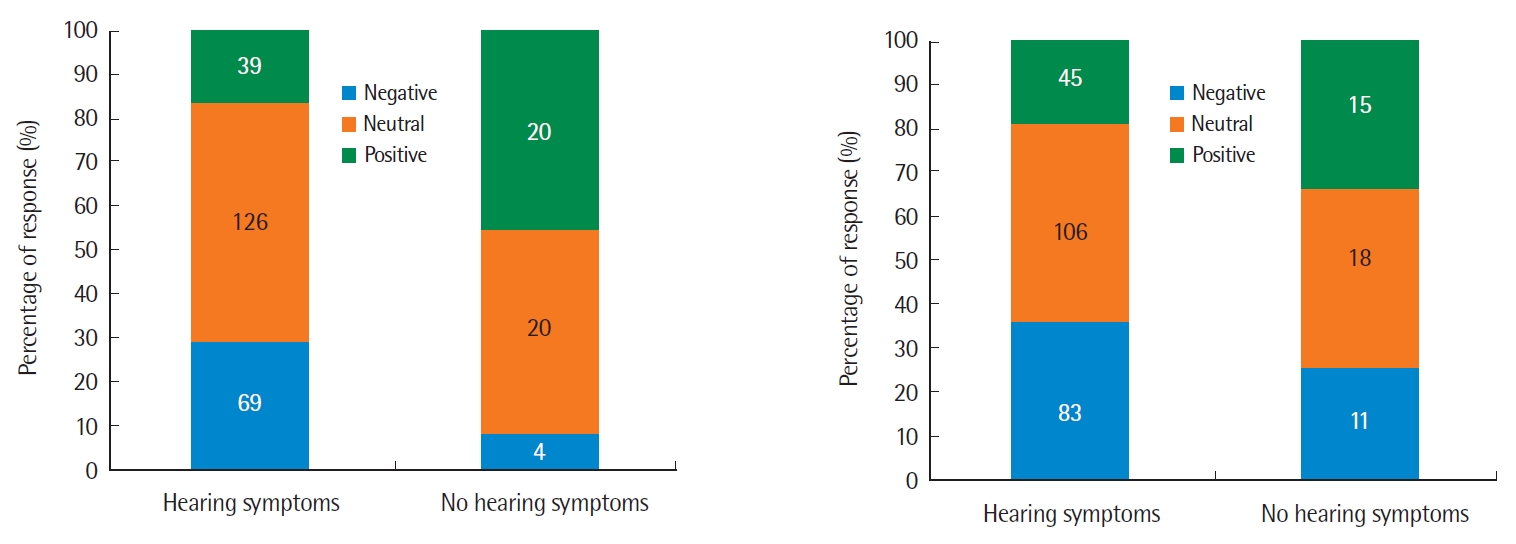
As seen in the left panel of Figure 2, for noisy environments (Factors 1 and 2), individuals who had at least one hearing symptoms were more likely to have a negative attitude toward noise than individuals who did not have any self-reported hearing symptoms. In contrast, as seen in the right panel, for the use of PLDs (Factor 3), no great difference was seen in the percentage of individuals who had a negative attitude between those with at least one hearing symptom and those with no hearing symptoms. See Appendix 2 for the raw data of the participants’ responses to the K-YANS question items.
The significant level of α=.05 was used for all statistical analyses. Table 3 presents the results of the multinominal logistic regression of hearing symptoms and attitudes toward noise in noisy environments (Factors 1 and 2). Experience with a hearing symptom has a significant effect on the college students’ attitude toward noise in noisy environments. Those who experienced a hearing symptom tend to have a negative attitude over a neutral attitude (z=2.02, p=.043); and a neutral attitude over a positive attitude (z=-2.96, p=.003) compared to those with no hearing symptoms. Results suggest that college students with at least one hearing symptom consider noise to be more problematic (i.e., something they would want to avoid) in noisy environments than those with no hearing symptoms. Additionally, there was an age effect on the students’ attitudes toward noise in noisy environment. The students tend to have a more negative attitude with age (z=2.61, p=.009).
Table 4 presents the results of the multinominal logistic regression of hearing symptoms and attitudes toward noise when using PLDs (Factor 3). Experience with a hearing symptom has no significant effect on whether the college students’ attitude toward noise is negative (z=.41, p=.685) or positive (z=-1.72, p=.085) when using PLDs. In addition, there was no significant age effect on attitudes toward noise when using PLDs. Results suggest that college students do not tend to consider noise from their PLD to be either problematic or acceptable.
Hearing Symptoms, Attitudes Toward Noise, and Use of Hearing Protection
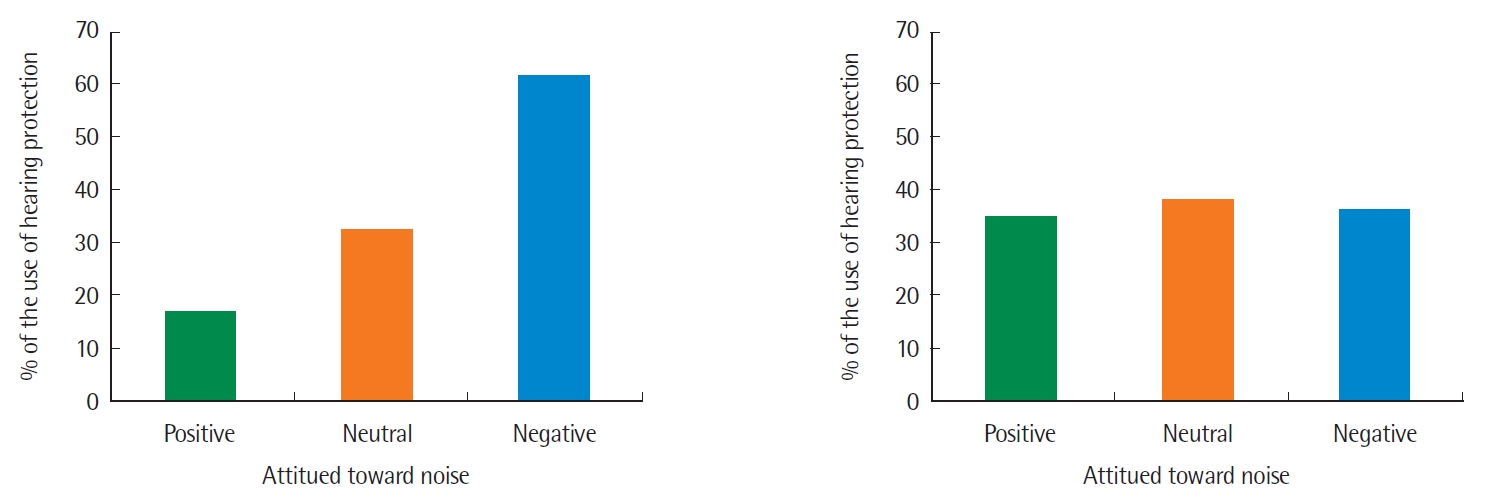
As seen in Figure 3, among the college students with at least one hearing symptom, those who have a negative attitude toward noise use hearing protection in noisy environments more than those who have a neutral or positive attitude. However, the percentages of hearing protection use were similar across all three attitudes toward noise when using PLDs.
Table 5 presents the results of the logistic regression when the college students were exposed to high levels of sound in noisy environments (Factors 1 and 2). There was a significant effect of hearing symptoms on the use of hearing protection (z=2.71, p=.007), indicating that those with at least one hearing symptom in noisy environments are more likely to use hearing protection than those with no hearing symptoms. Moreover, those with a neutral (z= -3.71, p<.001) or a positive (z=-4.15, p<.001) attitude toward noise used a form of hearing protection less than those with a negative attitude toward noise. In addition, there was no significant age effect (z=.35, p=.729) on the use of hearing protection. Results suggest that college students who have a hearing symptom or a negative attitude tend to use hearing protection in noisy environments more often than those who do not have a hearing symptom or have a positive or neutral attitude.
Table 6 presents the results of the logistic regression for the use of PLDs (Factor 3) that showed a significant association between hearing symptoms and the use of hearing protection (z=3.53, p<.001), indicating that those with at least one hearing symptom are more likely to use hearing protection than those with no hearing symptoms. However, there were no differences between hearing protection use and the attitudes toward noise when using PLDs (z=.30, p=.763 for neutral attitude; z=.30, p=.767 for positive attitude). Additionally, there was no significant age effect (z=.78, p=.433) on the use of hearing protection. Results suggest that when using PLDs, their experience with a hearing symptom tends to trigger their use of hearing protection but their attitudes toward noise do not.
DISCUSSION & CONCLUSION
The main purpose of this study was to investigate the relationship between college students’ hearing symptoms, attitudes toward noise, and use of hearing protection both when they were exposed to high levels of sound in noisy environment and when using their PLDs. This study was designed, in particular, to identify college students’ self-reported hearing symptoms caused by exposure to noise, explore the association between college students’ attitudes toward noise and their self-reported hearing symptoms, and examine whether their experience with hearing symptoms and attitudes toward noise are associated with the use of hearing protection. Over 84% of the college students reported having at least one hearing symptom caused by noise; with limited concentration rated most frequently, followed by high noise sensitivity, tinnitus, ear fullness, worry, ear soreness, and muffled hearing rated least frequently. When the college students were exposed to high levels of sound in noisy environments, those with at least one hearing symptom had a negative attitude toward noise more than those with no hearing symptoms. When they used their PLDs, however, there was no significant association between their attitudes toward noise and hearing symptoms. When the college students were exposed to high levels of sound in noisy environments, those with at least one hearing symptom or a negative attitude toward noise used hearing protection more often than their counterparts. When using PLDs, those with hearing symptoms used hearing protection more often than those with no hearing symptoms, but there was no significant association between their attitudes toward noise and their use of hearing protection.
84.17% of Korean college students reported their experience with at least one hearing symptom. Among the studies with the YANS and its relationship with hearing symptoms, this is a surprisingly high number compared to 39.6% of U.S. college students in Balanay and Kearney (2015). The most frequently reported hearing symptom in this study was limited concentration, as opposed toear pain after noise exposure in Balanay and Kearney (2015). Many studies on NIHL revealed tinnitus as being the most frequently reported hearing symptom in teenagers and young adults who are using PLDs and involved in various activities (Bogoch et al., 2005; Chung, Des Roches, Meunier, & Eavey, 2005; Degeest, Corthals, Vinck, & Keppler, 2014; Olsen-Widen & Erlandsson, 2004). Korean college students seem to suffer more from psycho-social effects of noise such as concentration and noise sensitivity than from medical factors such ear pain and tinnitus. These results indicate that an individual’s perception and experience with hearing symptoms may vary depending on their social, cultural, and environmental background.
Regarding the association between college students’ self-reported hearing symptoms and attitudes toward noise, it was hypothesized that those with hearing symptoms would perceive noise to be more negative than those with no hearing symptoms in both situations, when they were exposed to high levels of sound in noisy environment and when they were using PLDs. when the college students were exposed to high levels of sound in noisy environments, the results verified the hypothesis. The college students who self-reported having at least one hearing symptom are more likely to perceive noise as something negative and problematic to their health (i.e., something to be avoided) compared to those who self-reported having no hearing symptoms. This is consistent with the results in past studies (Balanay & Kearney, 2015; Holmes et al., 2007; Widén et al., 2009). The results imply that those with hearing symptoms caused by exposure to noise in their environment may have an increased awareness of noise and its deleterious effects on their hearing, which may serve to develop their negative attitudes toward noise. Additionally, this study found a significant age effect, with a greater likelihood of having a negative attitude toward noise with age. Older students may have been exposed to noise longer and have more chances to experience the negative effects of noise than younger students, causing older students to have a more negative attitude toward noise.
When college students used their PLDs, however, the results found no significant association between their attitudes toward noise and hearing symptoms, which did not verify our hypothesis. This result was consistent with the finding of You et al. (2020)’s survey research on the use of PLDs in Korean college students who did not accept any possible association between their PLD use and experience with hearing symptoms. A possible explanation for this lack of association is that since PLDs have become a necessity among college students and they use their PLDs in their everyday environments, they may not take into consideration the unsafe use of their PLDs to be a risk-taking behavior. As a result, college students may not have any negative or positive attitudes toward noise regardless of their experience with hearing symptoms, resulting in there being insignificant association between hearing symptoms and attitudes toward noise.
Regarding the use of hearing protection, when the college students were exposed to high levels of sound in noisy environments, the results verified our hypothesis that those with at least one hearing symptom or a negative attitude toward noise would use more hearing protection than their counterparts. The results showed that the use of hearing protection was associated with both hearing symptoms and attitudes toward noise. This is consistent with the findings in Balanay and Kearney (2015) which revealed that those with at least one hearing symptom tend to have a negative attitude toward noise, and that these outcomes are associated with the use of hearing protection. These results support the Health Belief Model that can be applied to college students’ risk-taking behavior (i.e., exposure to noise in their environments), which may produce negative outcomes (i.e., a hearing symptom and a negative attitude toward noise). These negative outcomes may serve as a trigger to a health-oriented behavior (i.e., use of hearing protection).
However, the Health Belief Model may not be applied to college students’ PLD use. The results did not verify our hypothesis that there would be an association between the attitudes and hearing symptoms, and the association would not lead to the increased use of hearing protection. The results revealed, first, that there was no association between the attitudes and hearing symptoms and, secondly, that the use of hearing protection was associated with hearing symptoms, but not with attitudes toward noise. Not surprisingly, the use of hearing protection was associated with hearing symptoms because those with hearing symptoms may be more aware of the negative effects of noise on hearing and more likely to use hearing protection than those with no hearing symptoms. As discussed above, college students may not consider the unsafe use of their PLDs to be a risk-taking behavior, which may not produce any attitude toward noise, resulting in there being no significant association between the use of hearing protection and attitudes toward noise.
The K-YANS was developed to reflect the two causes of NIHL in college students as indicated by the WHO (2015) exposure to high levels of sound in noisy environments and unsafe listening practices with PLDs. College students may consider their exposure to high levels of sound in noisy environments to be a risk-taking behavior, producing a negative attitude noise that can serve as a trigger to a health-oriented behavior (i.e., use of hearing protection). In contrast, college students may not consider their unsafe listening practices with PLDs to be a risk-taking behavior regardless of the presence of self-reported hearing symptoms, producing neither negative nor positive attitudes toward noise. As a result, there may be a higher risk for unpreventable NIHL when colleges students use their PLDs unsafely than when they are exposed to high levels of sound in noisy environments. Along with these findings on the use of PLDs in college students, the results of You et al. (2020) provide a window into aural (re)habilitation for NIHL in Korean college students. You et al. (2020) revealed that Korean college students are knowledgeable about the signs of NIHL, the negative effects of PLD use, and the fact that NIHL is preventable. In contrast, they are not knowledgeable about safe listening practices with PLDs and demonstrate little desire to change their PLD use pattern (e.g., lengths of PLD use, volume setting on PLD, and listening environments). Thus, hearing conservative programs should place greater focus on educating college students on how to use PLDs safely and transforming their attitudes toward noise, which can encourage them to take preventative measures against severe and permanent noise-induced hearing loss.
It is important to note that there were some limitations to the current study. The responses to a self-reporting survey are inherently biased due to the participants’ personal experiences being relatively subjective. This might be especially true of our participants’ report of their hearing symptoms associated with noise. They might have overreported or underreported their hearing symptoms. It is also possible that the participants’ response to the question regarding whether they have normal hearing in the demographic information section might be inconsistent with their response to the question regarding whether they have a hearing loss or muffled hearing in the hearing symptom description section. More accurate data can be obtained when the self-reported information is combined with other medical reports on their hearing status. In addition, the study’s sample did not include an equal amount of female and male participants and did not represent all the regions of South Korea, which may limit the generalizability of the study results. Future research may consider adopting a stratified sampling strategy which is used to generate a sample that represents the population of interest.